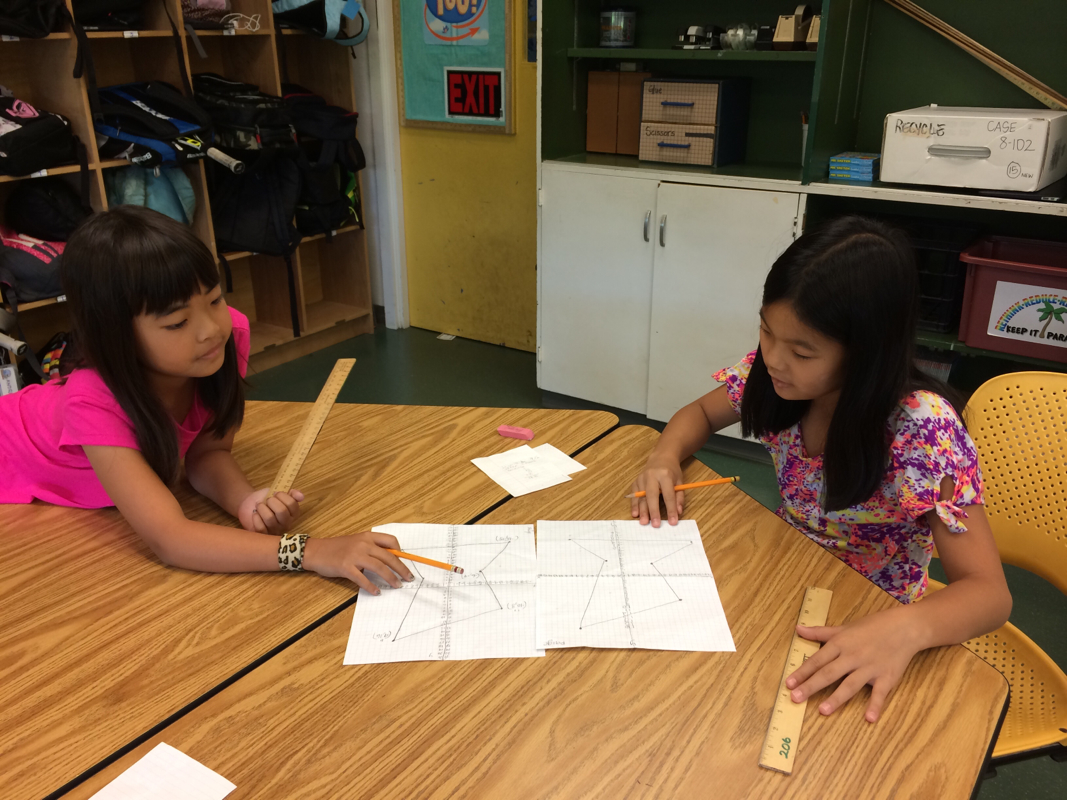
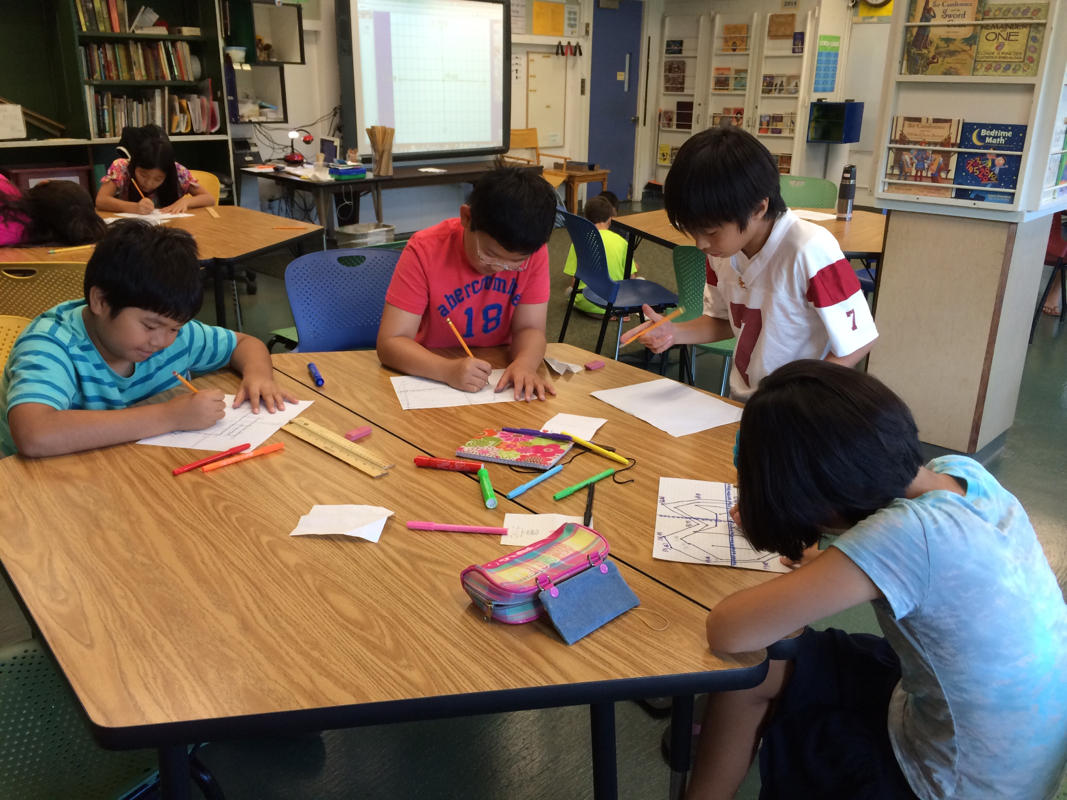
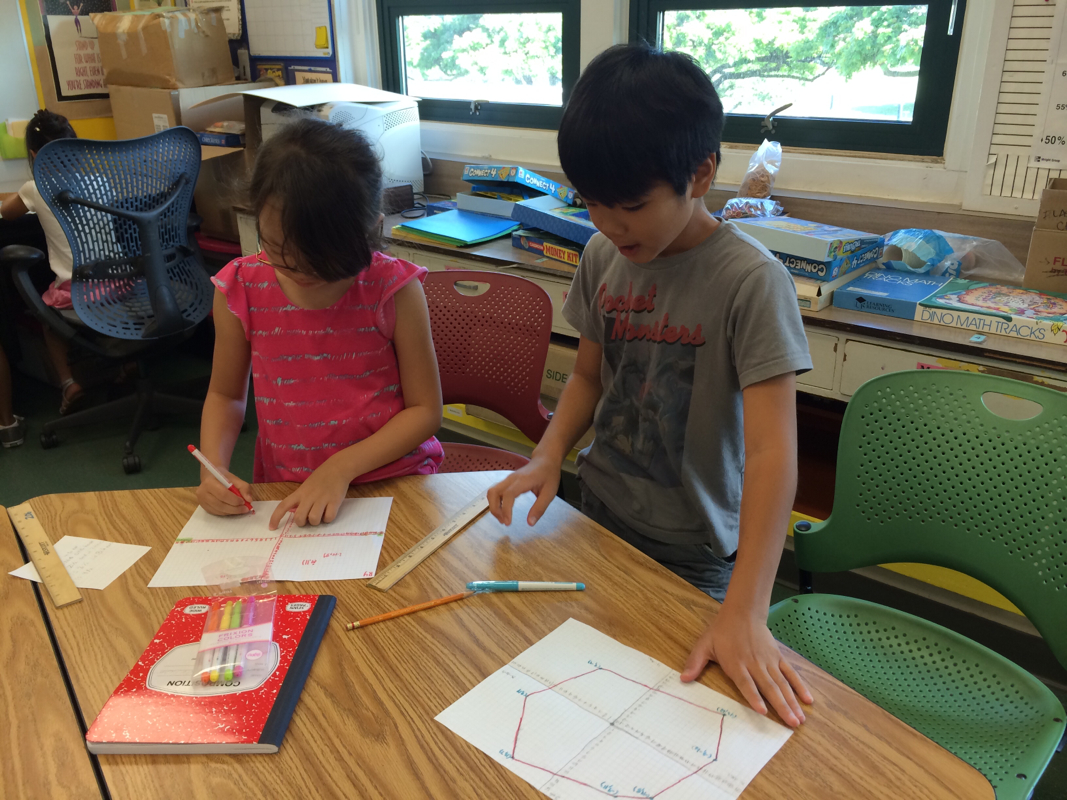
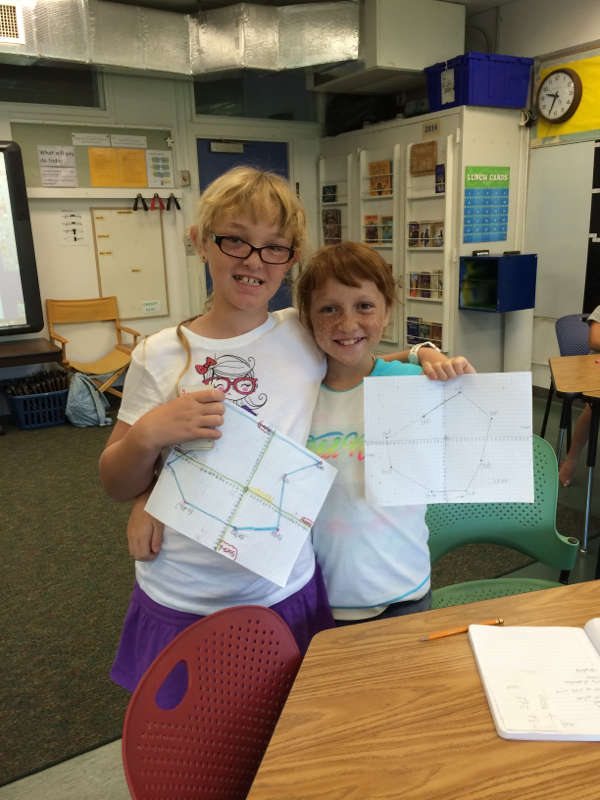
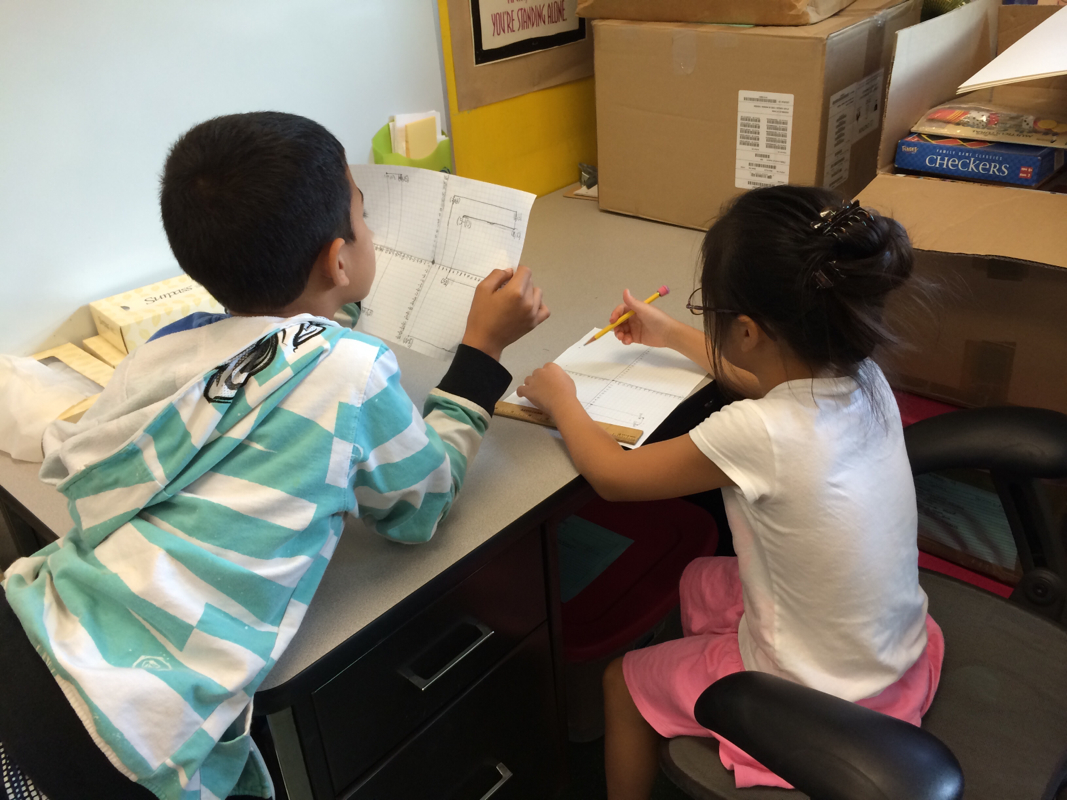
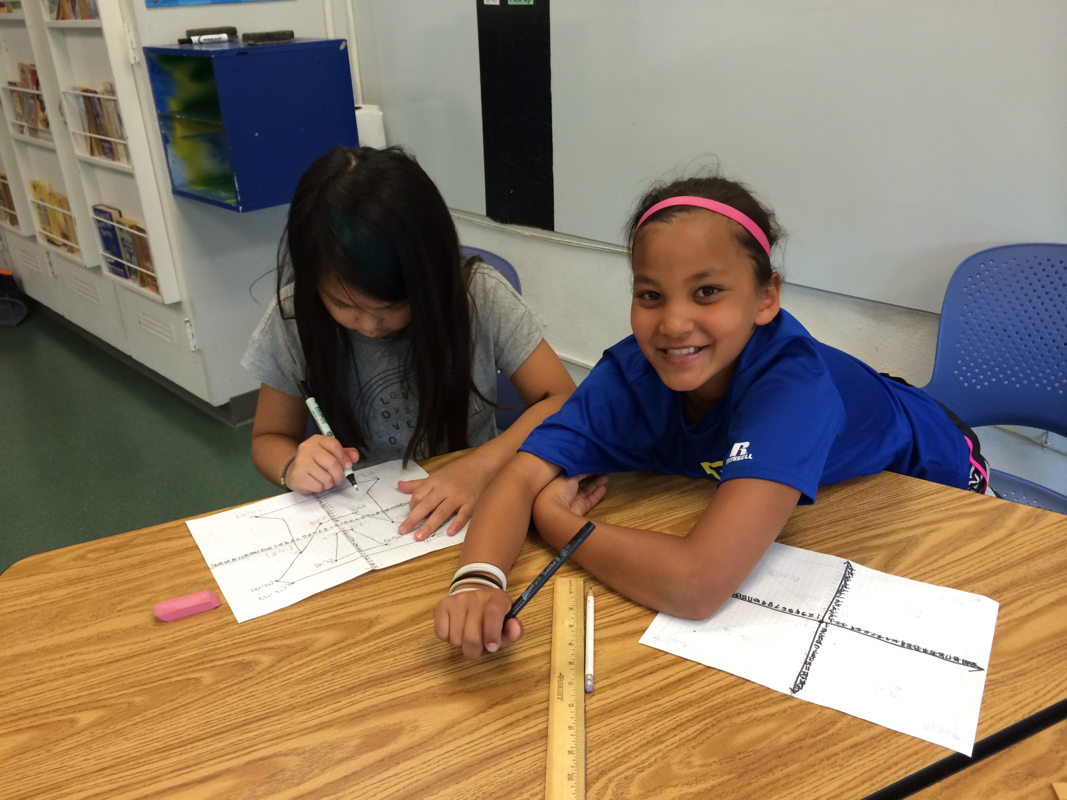
On Tuesday, we learned how to plot points on a graph. We were exposed to new vocabulary terms, such as y-axis, x-axis, origin, horizontal, and vertical. Students created their own shapes, and told their partner coordinates to replicate their shape. Vice versa, they were told coordinate points, and they were to replicate their partner's shape.
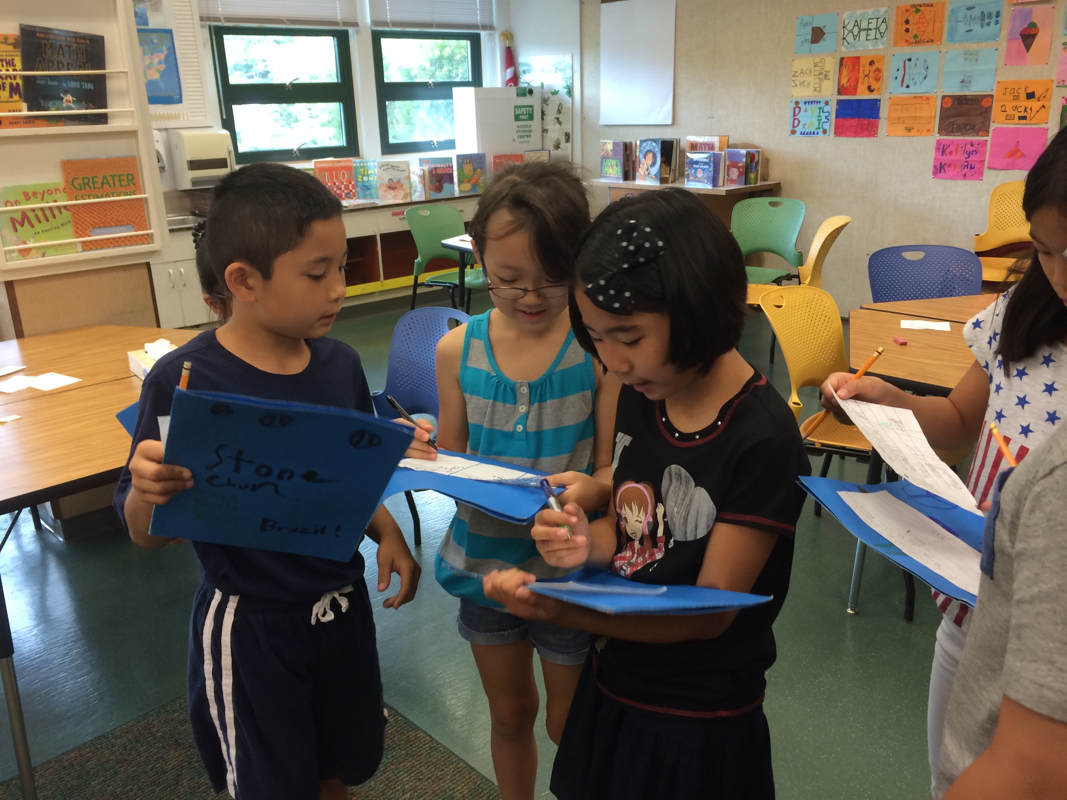
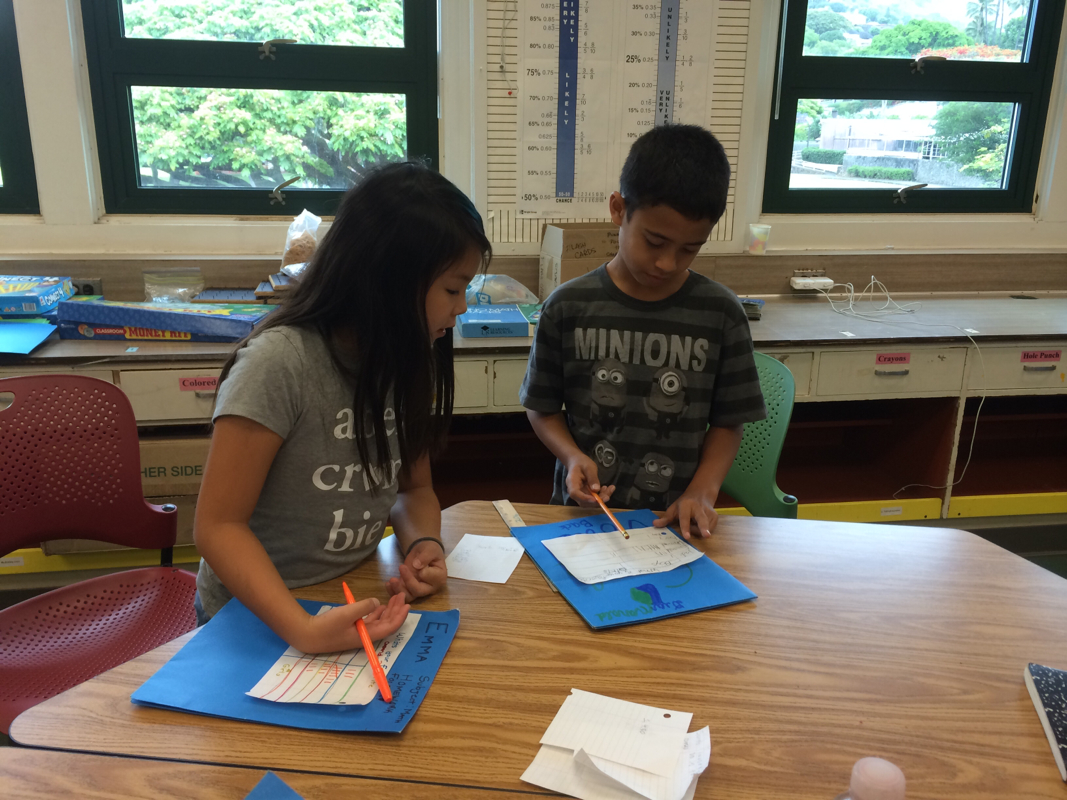
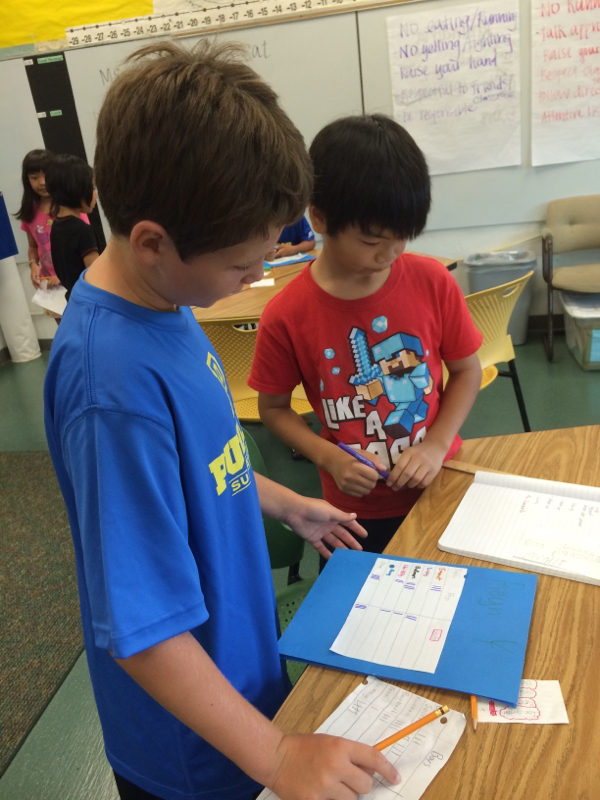
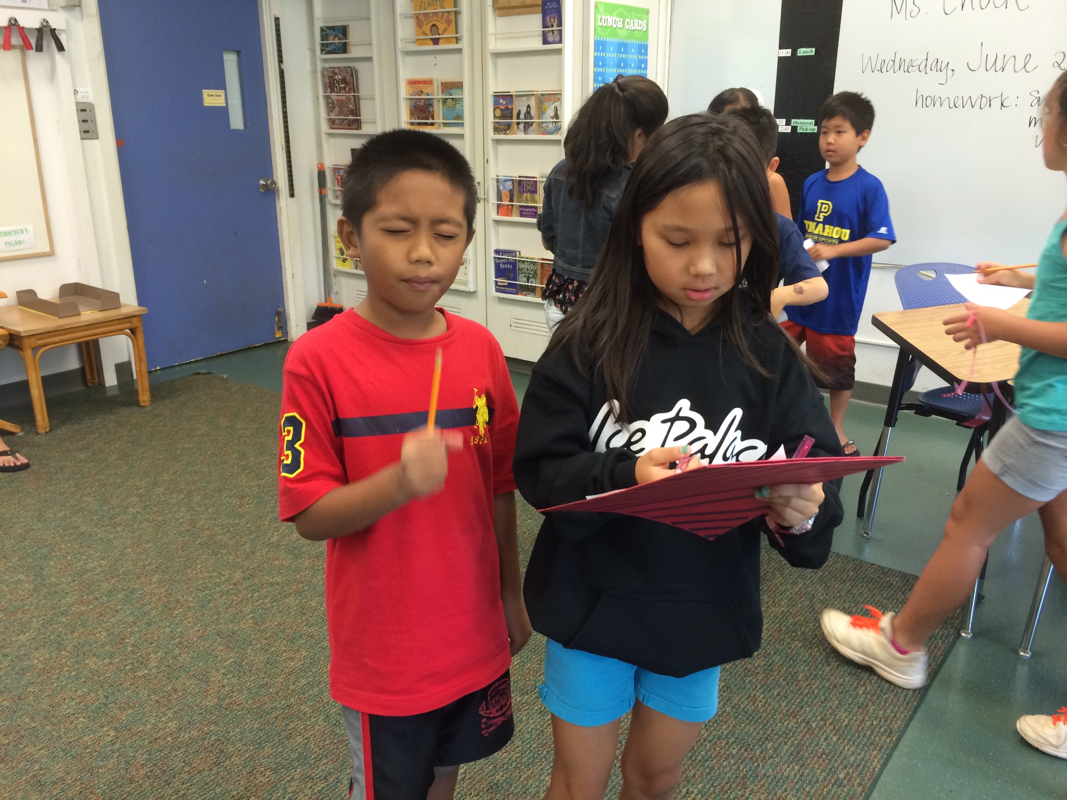
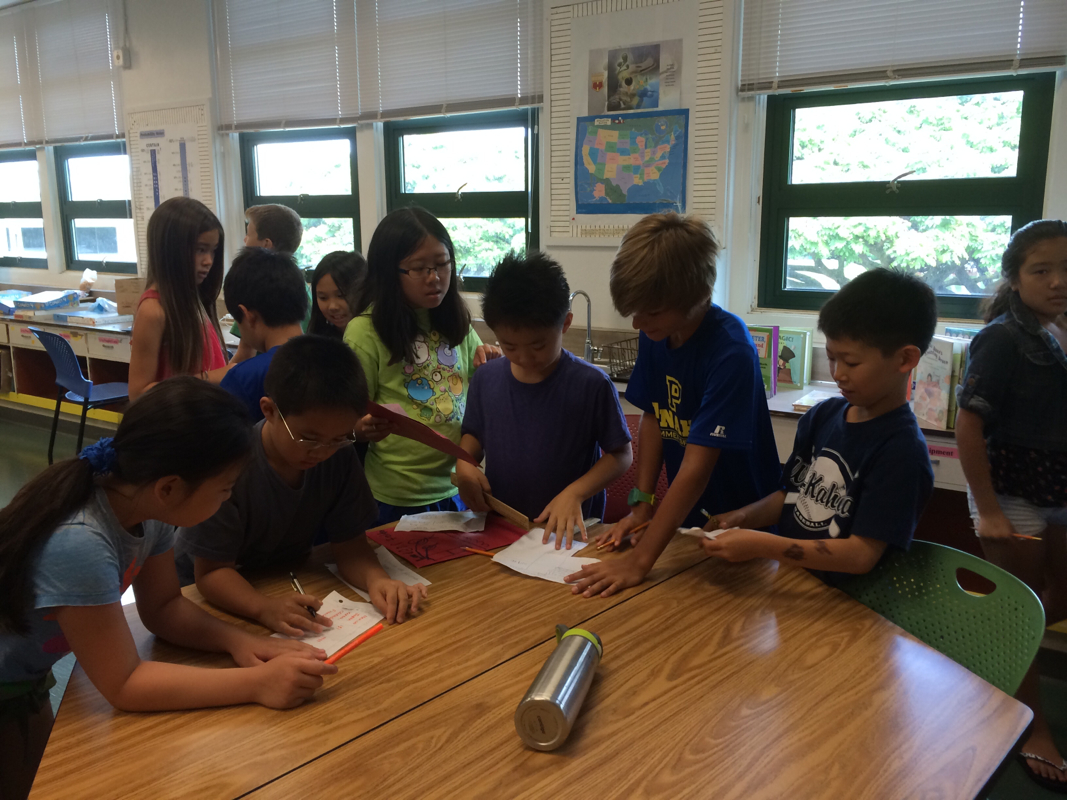
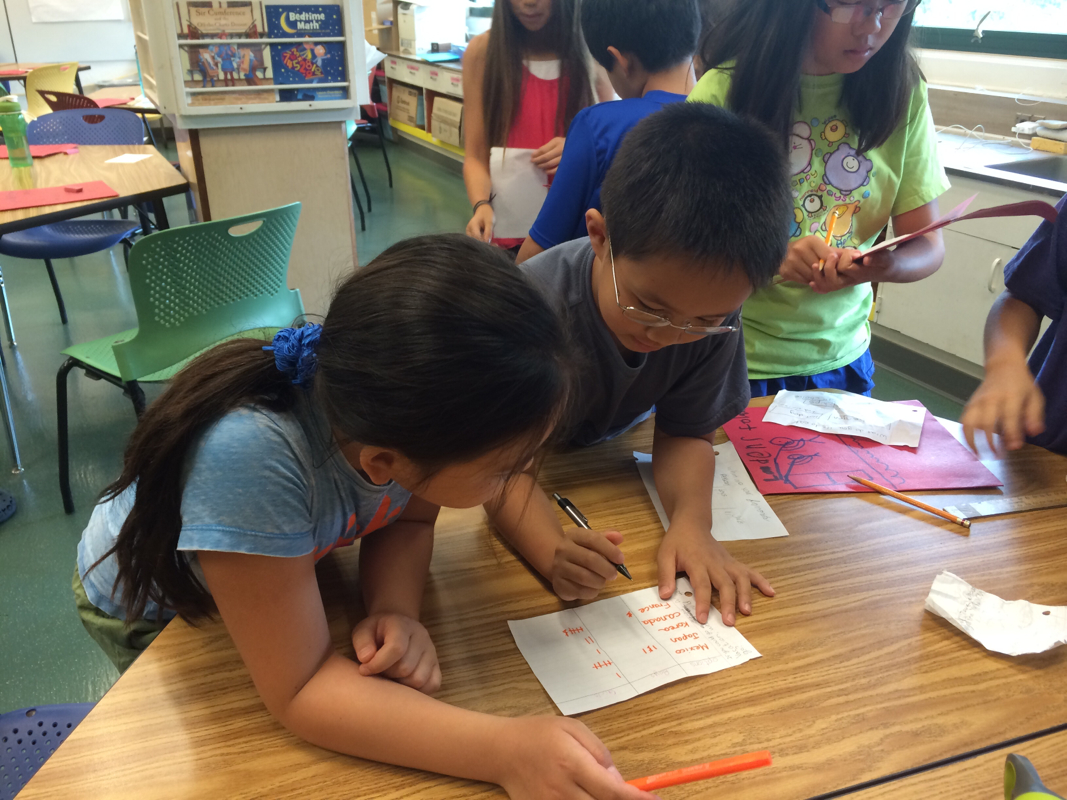
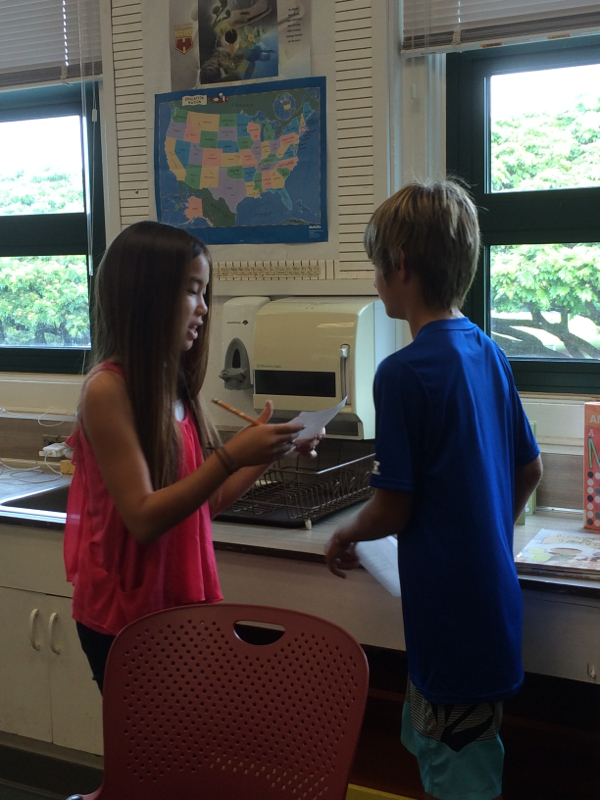
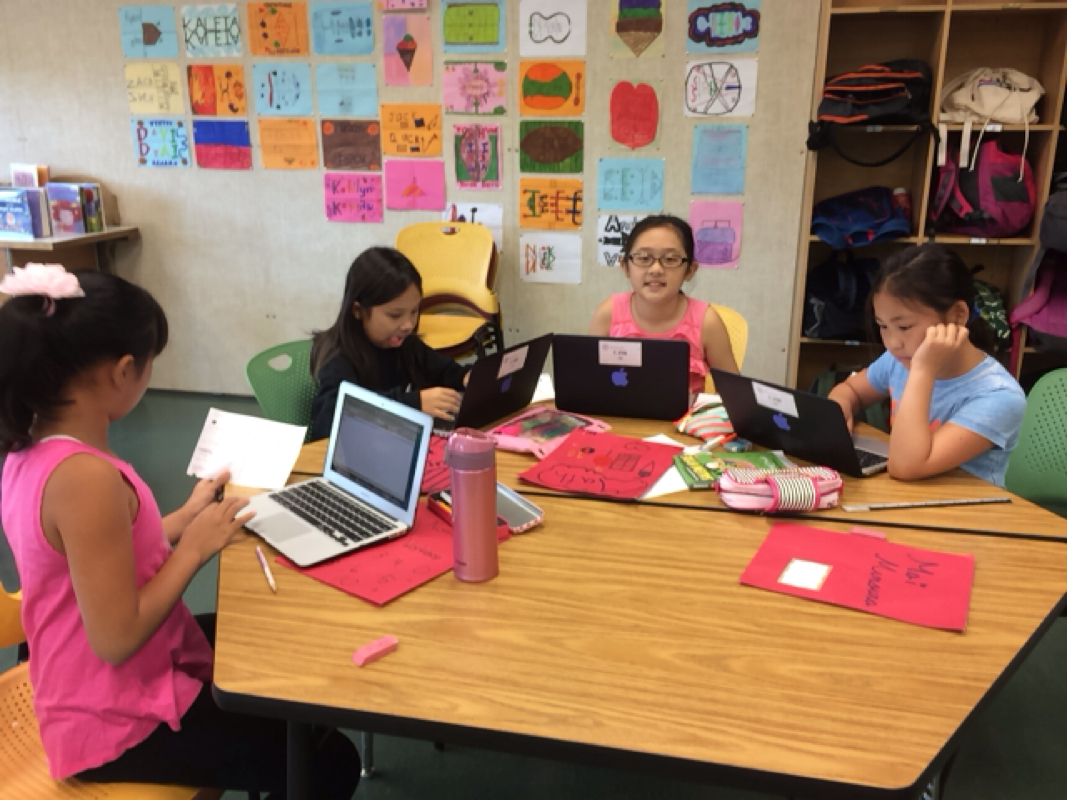
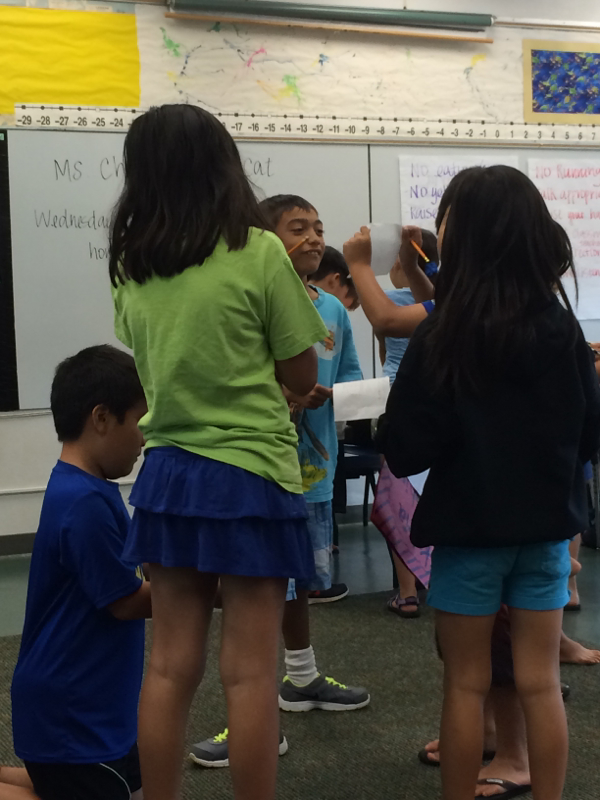
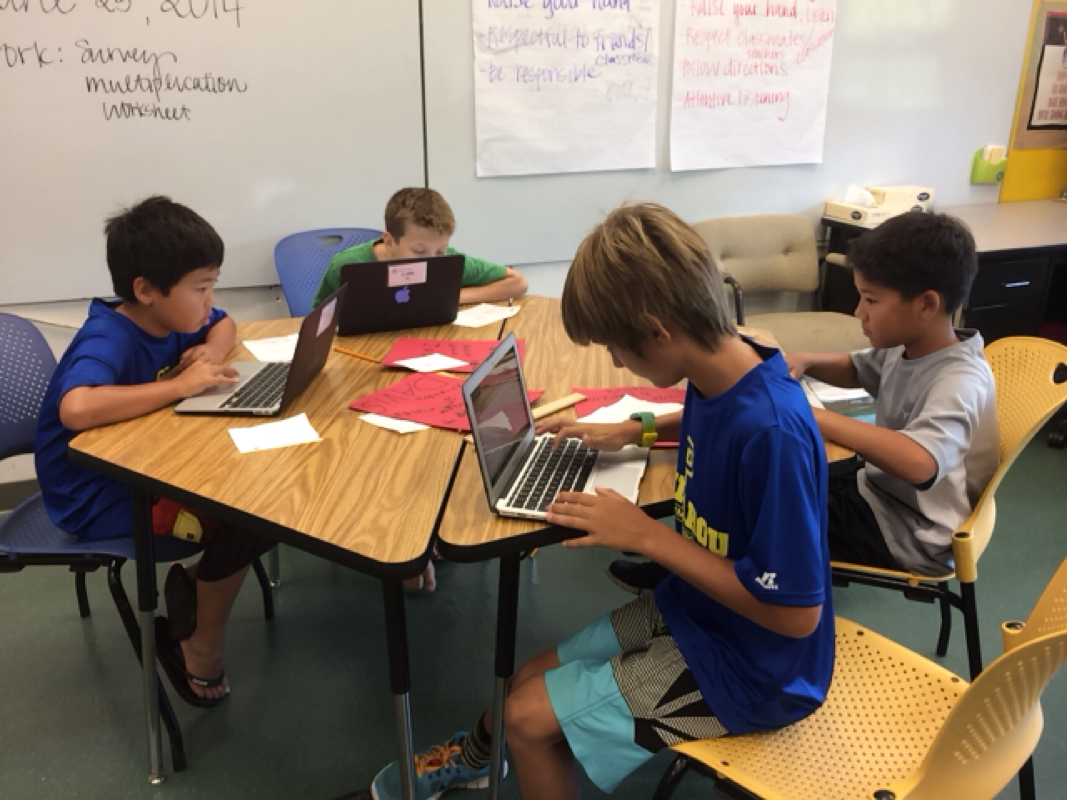
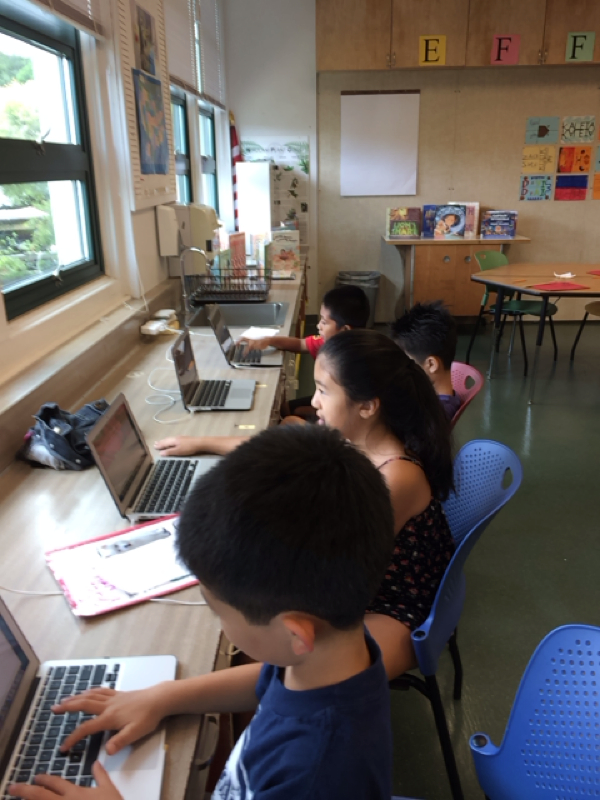
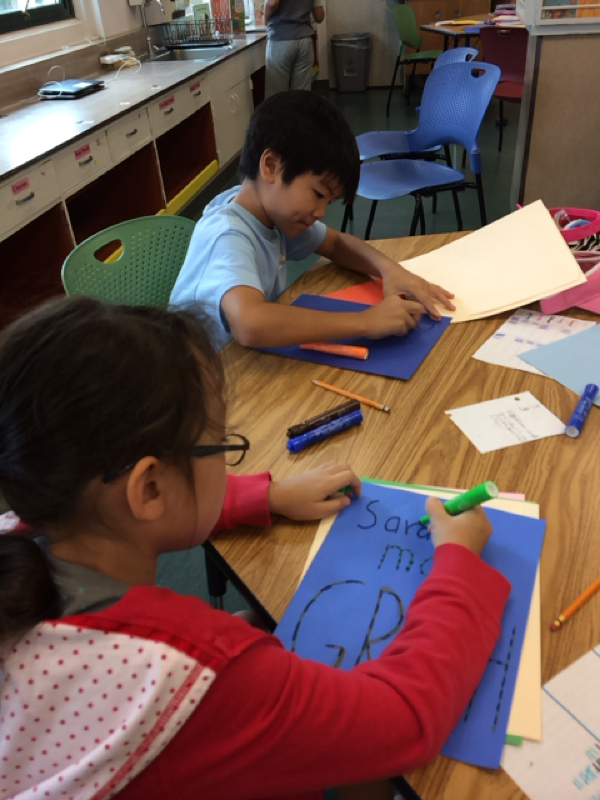
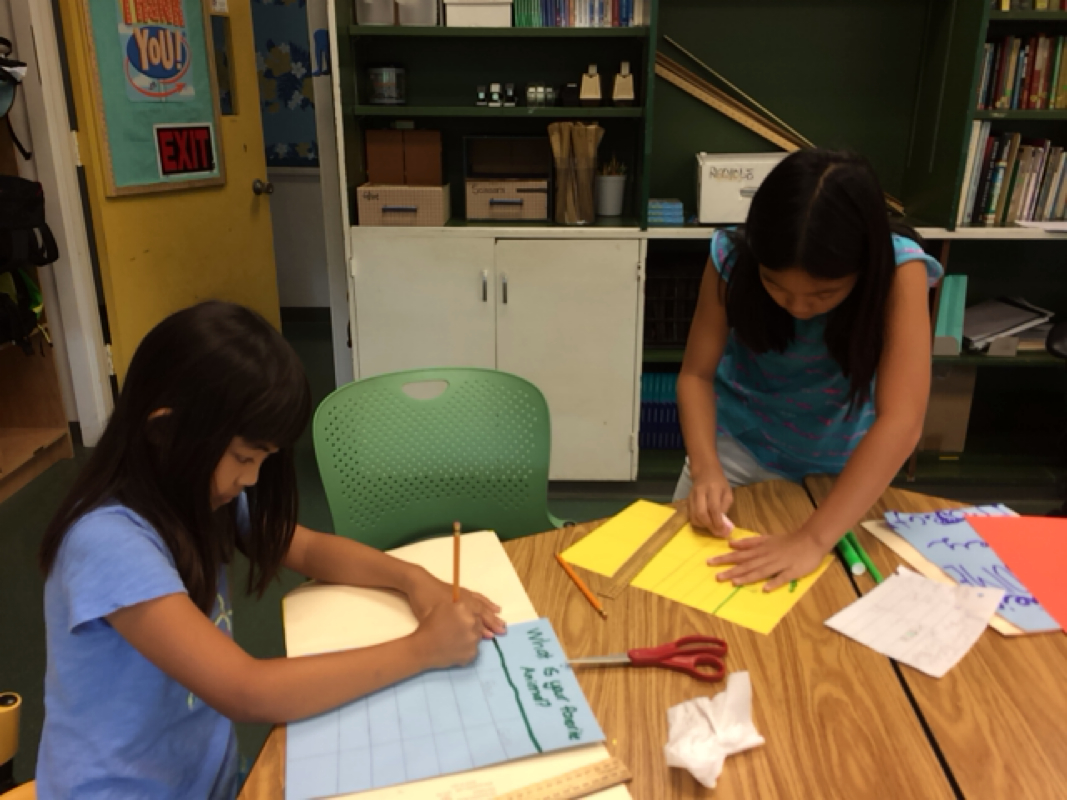
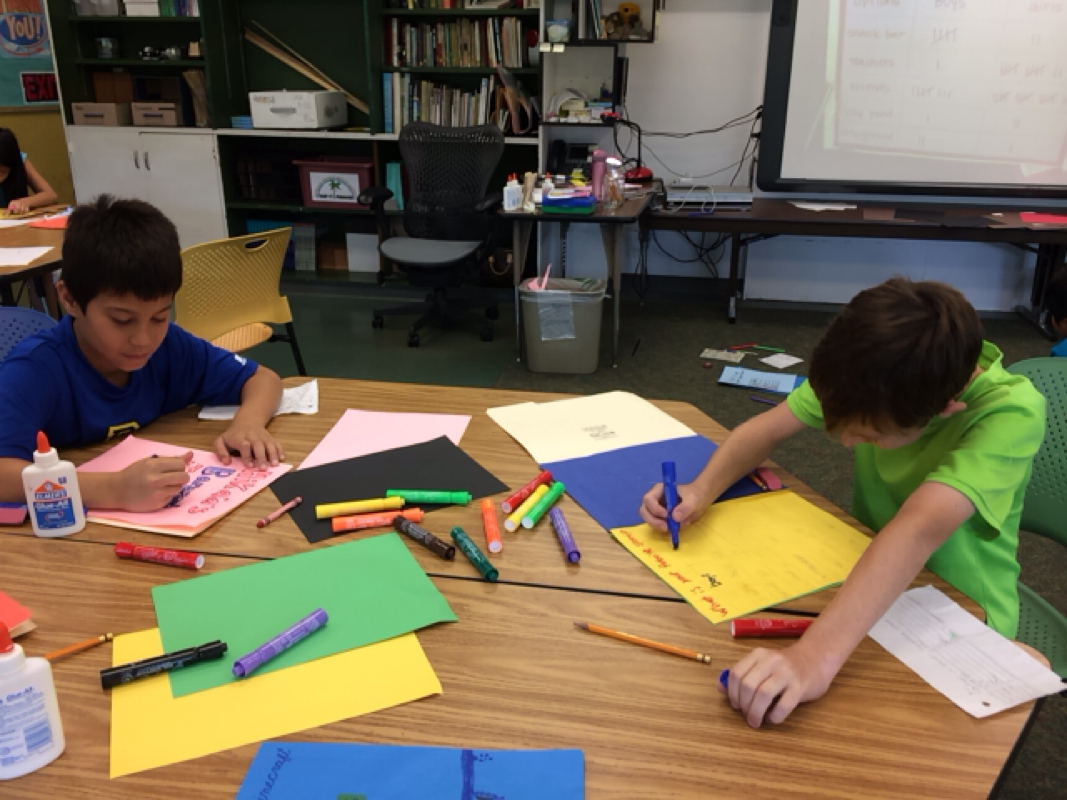
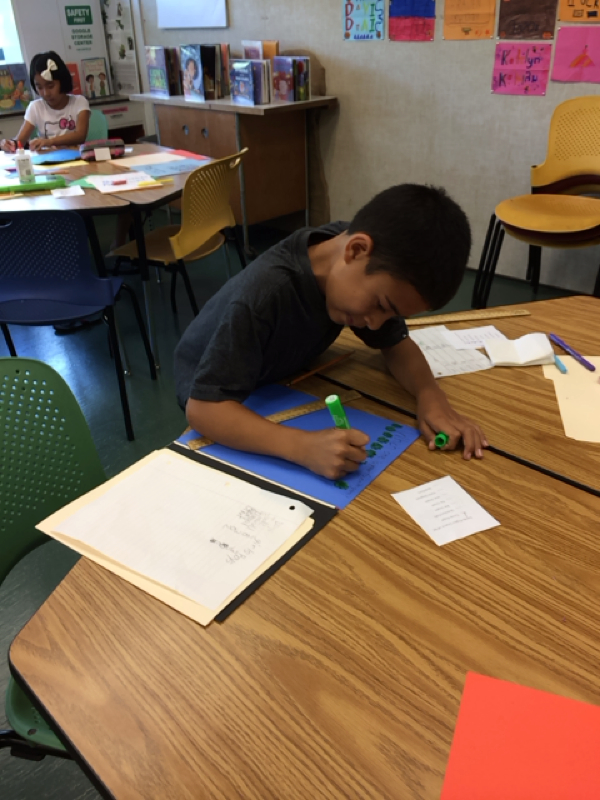
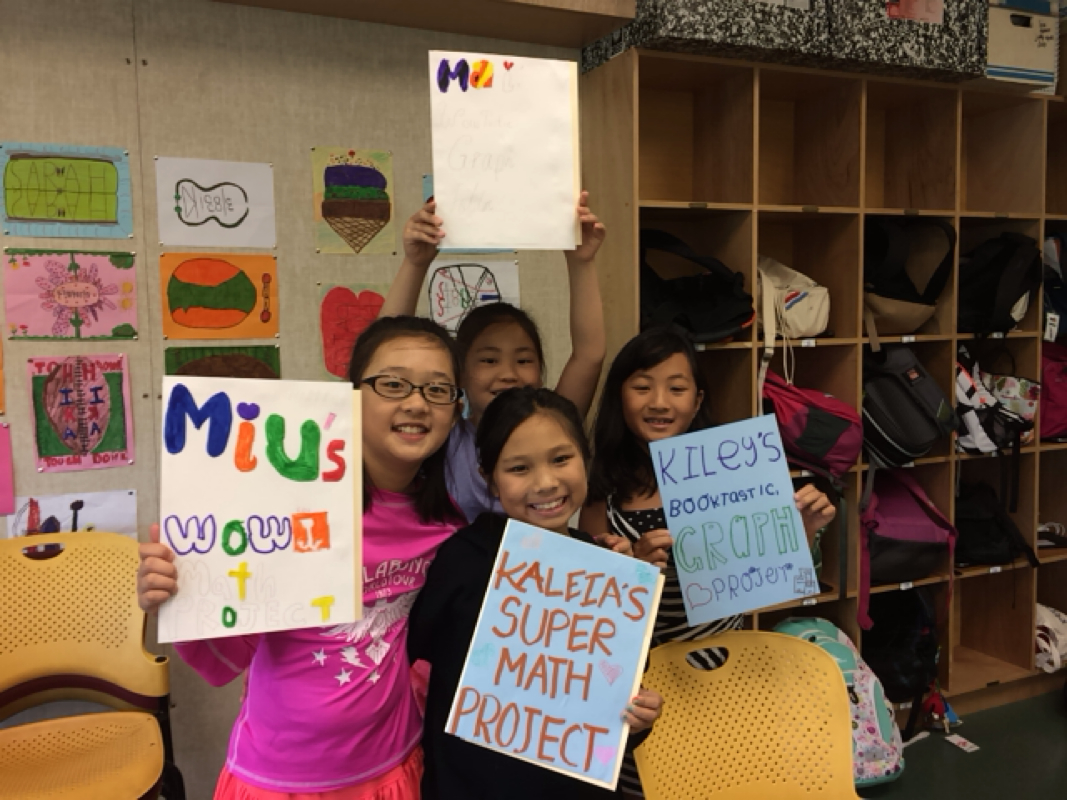
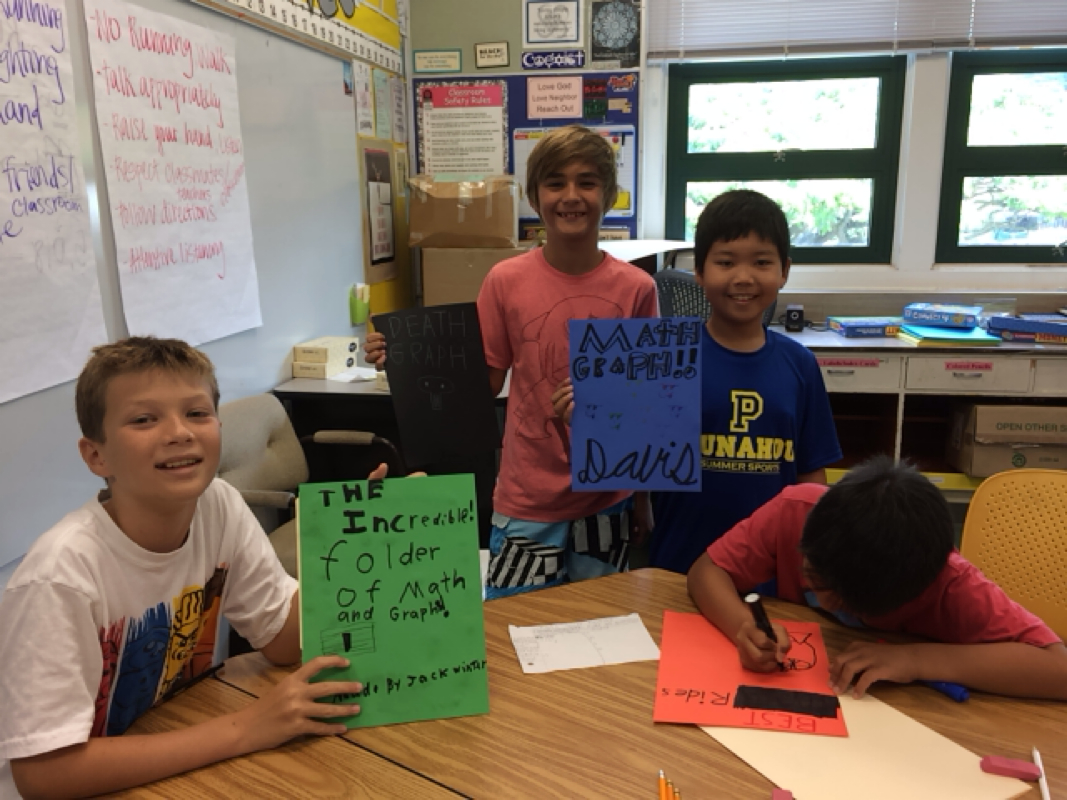
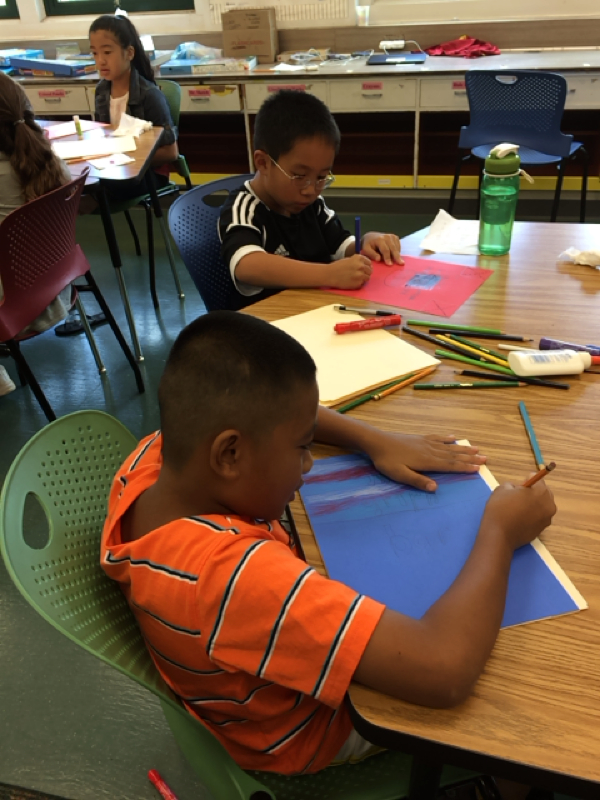
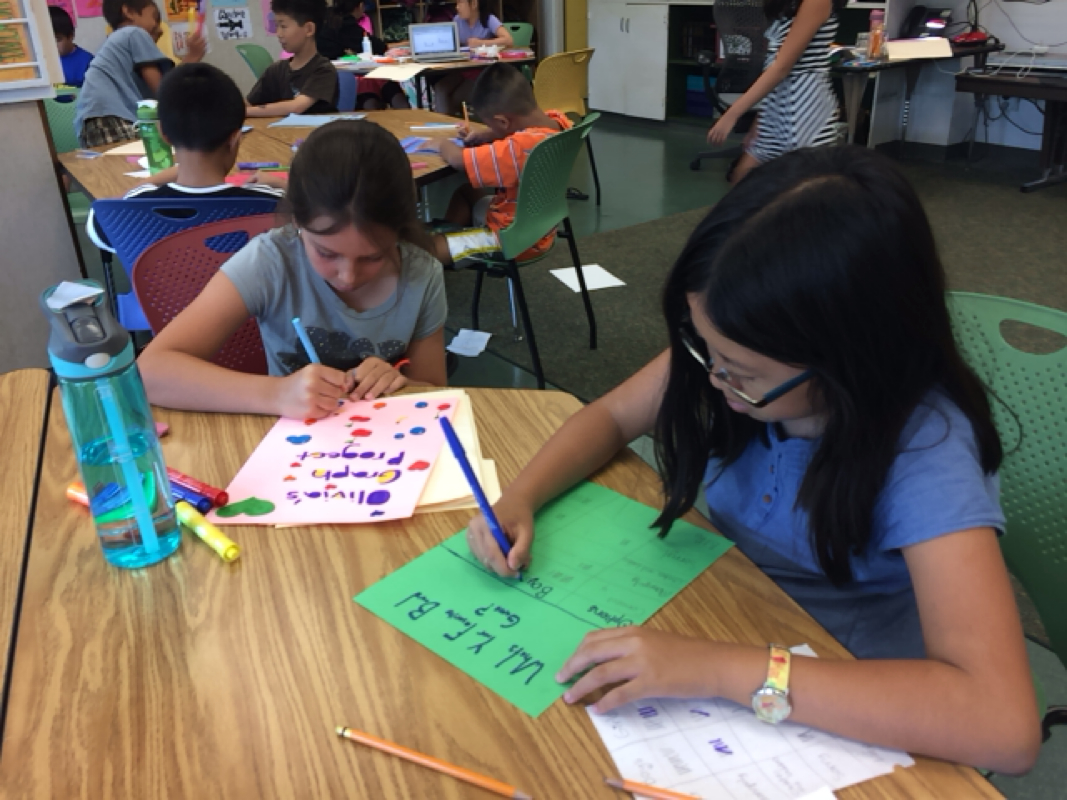
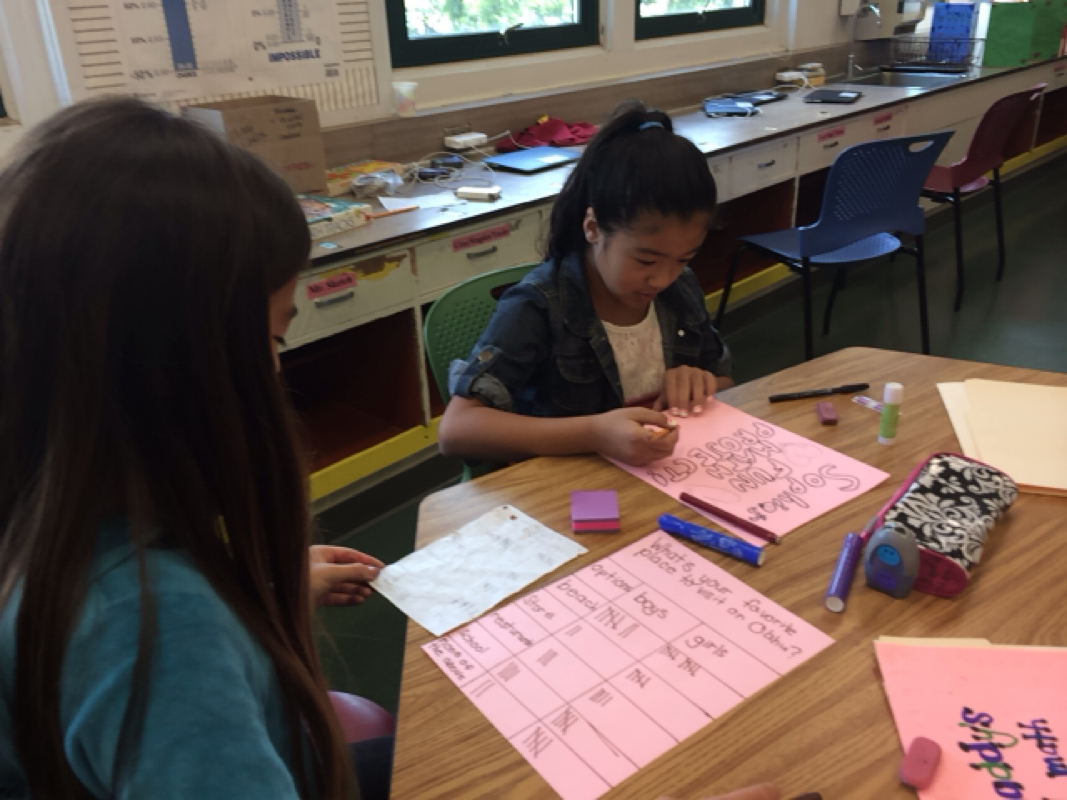
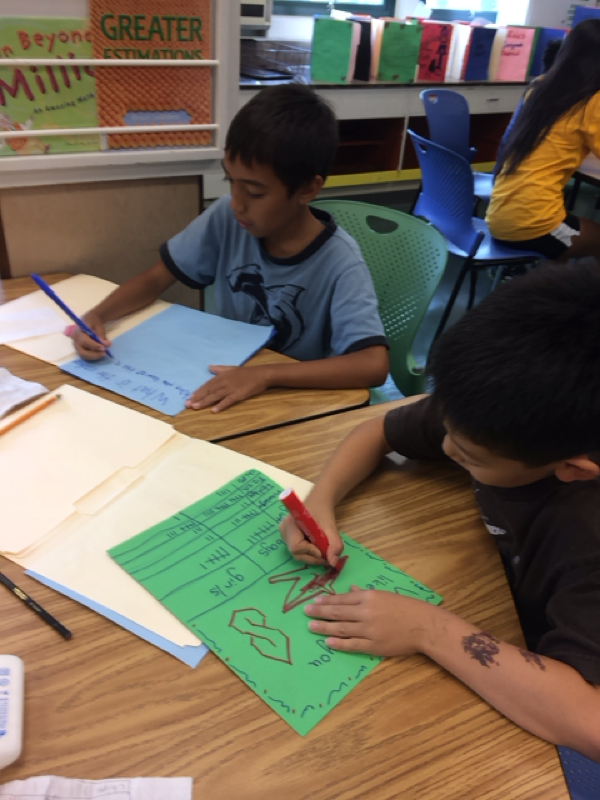
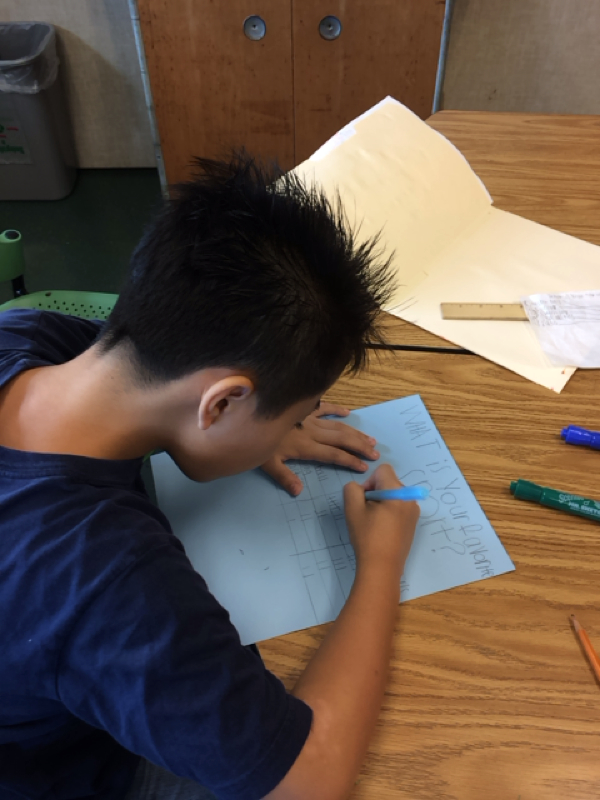
Additionally, on Wednesday, Thursday, Friday we are conducting our own survey. Students are to collect data, by asking peers a question, with five possible answer choices. This question should be a topic they are curious about. With this data, we will be experimenting with bar and line graphs, line charts, and venn diagram. Students will also be introduced to the concepts of mean, median, mode, and range.
Additionally, on Wednesday, Thursday, Friday we are conducting our own survey. Students are to collect data, by asking peers a question, with five possible answer choices. This question should be a topic they are curious about. With this data, we will be experimenting with bar and line graphs, line charts, and venn diagram. Students will also be introduced to the concepts of mean, median, mode, and range.
 RSS Feed